Hi all,
I'm trying to display two charts with shared y-axes side-by side and with their respective x-axes shown at the top. This works for the 1st chart on the left, but not for the 2nd one on the right, see the minimal example below. Am I doing something wrong or is this a bug?
Note that it works fine if I change shared_yaxes to False but I really need them shared.
import plotly.plotly as py
import plotly.graph_objs as go
from plotly import tools
from plotly.offline import init_notebook_mode, iplot

init_notebook_mode()

trace_left = go.Scatter(x=[3, 2, 5], y=[1, 2, 3], name='Left')
trace_right = go.Scatter(x=[2, 6, 7], y=[1, 2, 4], name='Right')

fig = tools.make_subplots(rows=1, cols=2, specs=[[{}, {}]], shared_yaxes=True)
fig.append_trace(trace_left, 1, 1)
fig.append_trace(trace_right, 1, 2)

layout = go.Layout(
    xaxis=dict(side='top'),
    xaxis2=dict(side='top'),   # <- 2nd x-axis should be on top as well but isn't
)

fig['layout'].update(layout)
iplot(fig, filename='issue')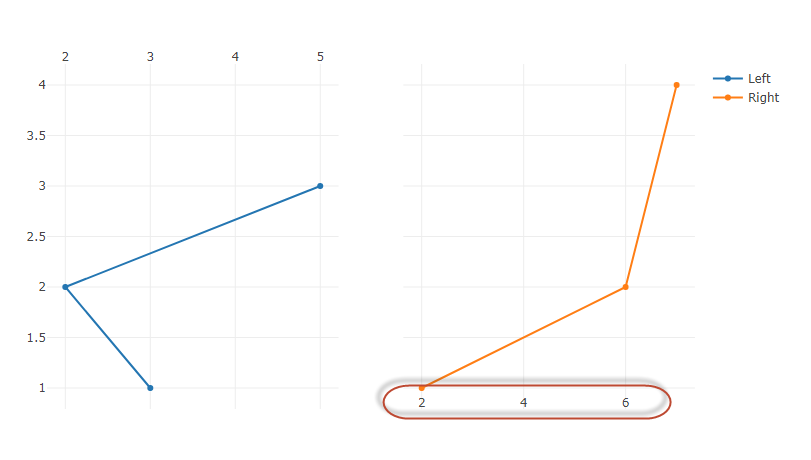
Hi all,
I'm trying to display two charts with shared y-axes side-by side and with their respective x-axes shown at the top. This works for the 1st chart on the left, but not for the 2nd one on the right, see the minimal example below. Am I doing something wrong or is this a bug?
Note that it works fine if I change
shared_yaxestoFalsebut I really need them shared.